Zenmap

Description
Zenmap is the GUI frontend of Nmap. It enables to use Nmap without fully knowing the syntax (sometimes complex).
Installation
Please refer to Nmap installation howto
Interface
Start the interface
To start Zenmap, simply enter:
$ sudo zenmap
GUI and language
To change the language of the GUI, use the LANG environment variable:
$ export LANG="en_US.UTF-8"
Menu
- Scan
- New Window: Open a new instance of Zenmap
- Open Scan: Open a previously saved scan in a new instance of Zenmap if there is already a scan in current instance, otherwise in current instance.
- Open Scan in This Window: Open a previously saved scan in current instance of Zenmap
- Save Scan: Save current scan parameters and results in a file
- Save All Scans to Directory: Save all scans parameters and results from opened instances in a directory
- Print: Send scan content to printer
- Close Window: Close current instance of Zenmap
- Quit: Close all instances of Zenmap
- Tools
- Compare Results: Open scan comparer
- Search Scan Results: Enable to search for scans by filtering on Date, Host in route, Include directory, Keyword, Operating System, Options, Port, Profile Name, Service, Target.
- Filter Hosts: Enable to filter host with a mask
- Profile
- New Profile or Command: Create a new scan profile
- Edit Selected Profile: Edit selected scan profile
- Help
- Help: Show help
- Report a Bug: Show procedure to report a bug
- About: Show splash screen with version
Scan Specification
This panel enables to specify the target, the scan parameters and to launch the scan.
Target
Target specification can be a hostname, an IP address, a netbock with cidr notation
Profile
Zenmap is packaged with default profiles:
- Intense scan
- command = nmap -T4 -A -v
- An intense, comprehensive scan. The -A option enables OS detection (-O), version detection (-sV), script scanning (-sC), and traceroute (--traceroute). Without root privileges only version detection and script scanning are run. This is considered an intrusive scan.
- Intense scan plus UDP
- command = nmap -sS -sU -T4 -A -v
- Does OS detection (-O), version detection (-sV), script scanning (-sC), and traceroute (--traceroute) in addition to scanning TCP and UDP ports.
- Intense scan, all TCP ports
- command = nmap -p 1-65535 -T4 -A -v
- Scans all TCP ports, then does OS detection (-O), version detection (-sV), script scanning (-sC), and traceroute (--traceroute).
- Intense scan, no ping
- command = nmap -T4 -A -v -Pn
- Does an intense scan without checking to see if targets are up first. This can be useful when a target seems to ignore the usual host discovery probes.
- Ping scan
- command = nmap -sn
- This scan only finds which targets are up and does not port scan them.
- Quick scan
- command = nmap -T4 -F
- This scan is faster than a normal scan because it uses the aggressive timing template and scans fewer ports.
- Quick scan plus
- command = nmap -sV -T4 -O -F --version-light
- A quick scan plus OS and version detection.
- Quick traceroute
- command = nmap -sn --traceroute
- Traces the paths to targets without doing a full port scan on them.
- Regular scan
- command = nmap
- A basic port scan with no extra options.
- Slow comprehensive scan
- command = nmap -sS -sU -T4 -A -v -PE -PS80,443 -PA3389 -PP -PU40125 -PY --source-port 53 --script all
- This is a comprehensive, slow scan. Every TCP and UDP port is scanned. OS detection (-O), version detection (-sV), script scanning (-sC), and traceroute (--traceroute) are all enabled. Many probes are sent for host discovery. This is a highly intrusive scan.
Scan results
Hosts/Services Switcher
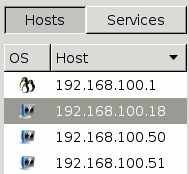
These 2 buttons enable to switch between 2 views:
- Hosts: Show list of scanned hosts in the panel. By clicking on a host, the tabs are loaded for this host.
- Services: Show list of open ports discovered on all scanned hosts. By clicking on a port, the tabs are loaded for this port, for all hosts.
Tabs
Nmap output
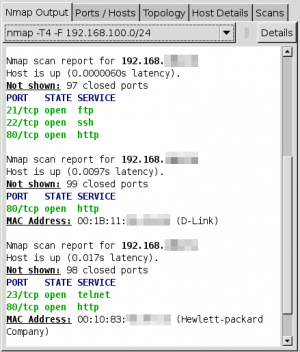
This tab shows the list of scanned hosts, and for each, the list of open ports, and eventually associated services, versions and OS information.
Ports / Hosts
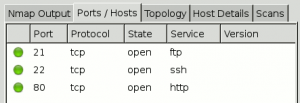
Shows the list of open ports for selected host (for host view):
- port
- protocol
- state
- service
- version
or shows the list of hosts that have selected port opened (for port view)
- host
- port
- protocol
- state
- service
- version
Topology
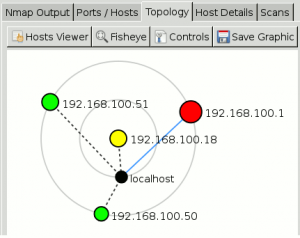
This view shows a graphical map of scanned hosts, based on traceroute information. It places hosts on circles (layers) depending on the number of hops.
Host Details
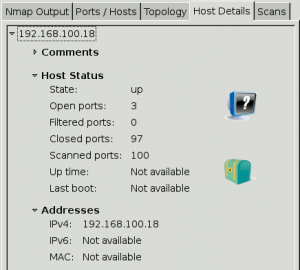
Show some details about the scan.
Scans
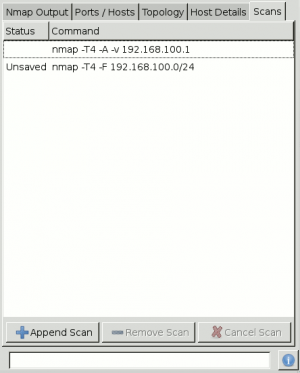
Show historical list of scans.
Comments
- Backtrack/GUI/Information-Gathering/Network-Analysis/Identify-Live-Hosts
- Backtrack/GUI/Information-Gathering/Network-Analysis/Network-Scanners
- Backtrack/GUI/Information-Gathering/Network-Analysis/OS-Fingerprinting
- Backtrack/GUI/Information-Gathering/Network-Analysis/Service-Fingerprinting
- Backtrack/GUI/Information-Gathering/Network-Analysis/SMTP-Analysis
- Backtrack/CLI/usr/local/bin
- Penetration-testing
- Network/Port-scan
